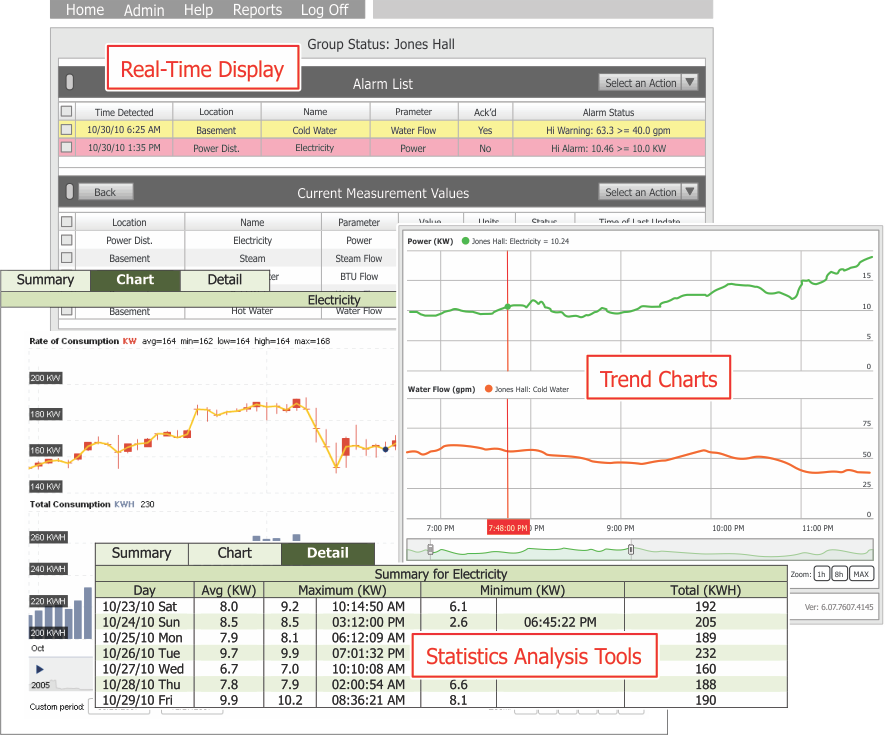
A verity of easy to use data analysis tools are provided with the SmartScan system. Of these, the trend chart (plot of measurement values vs. time) is most often used.
Users can select one or more monitoring points and display them together in a common chart. One can pan the chart left and right as well as zoom in and display a small section of the chart with ease. Multiple plots on a single chart are all synchronized.